Monitor your Nextcloud logs for suspicious activities with Grafana Loki
As an admin of a Nextcloud instance with tens of users, you usually don't know what's going on on the server. Nextcloud is generally known for its data thriftiness, which is why you can only access the users' data in a roundabout way.
However, Nextcloud is not necessarily a black box. With the help of Nextcloud's own audit logs, you can still look inside.
General design
On the Nextcloud instance we install
- Promtail as log collector
- Loki as backend for log monitoring
- Grafana as a dashboard for the logs
- Prometheus Alertmanager for alerting
We use a pre-built dashboard to monitor the activities on the Nextcloud instance and get notified if necessary.
At Nextcloud itself, we only enable the audit logs.
Features
- Login monitoring
- Rights changes in user and file context
- Access monitoring of public shares
- Password changes
Enable Nextcloud audit logs
The audit logs are only for the administrator and should not be freely accessible.
The configuration is simple and is done via an entry in the config.php of Nextcloud.
 'log_type_audit' => 'file',
 /**
 *
 * Defaults to ``[datadirectory]/audit.log``
 */
'logfile_audit' => '/var/log/audit.log',
Reboot your Nginx/Apache2 instance for the change to become effective:
# NGINX
systemctl restart nginx

# Apache2 CentOS
systemctl restart httpd

# Apache2 Debian
systemctl restart apache2
Install Grafana, Alertmanager and Loki
As usual, we install Loki and Grafana as a Docker compose stack.
Create a new grafana folder and the following files and folders inside this folder:
.
│
├── docker-compose.yml
├── loki
│   └── alert
│   ├── chunks
│   ├── index
│   ├── rules
│   ├── wal
│   ├── loki-local-config.yaml
├── prom
│   └── alertmanager.yml
mkdir grafana
cd grafana
touch docker-compose.yml
mkdir {loki,prom}
cd loki
touch loki-local-config.yaml
mkdir {chunks,index,rules,wal}
touch ../prom/alertmanager.yml
Loki starts by default with the user UID and GID "10001:10001", so we need to adjust the file permissions for loki in the created loki folder:
chown -R 10001:10001 loki
Edit docker-compose.yml and add:
version: '3.1'

networks:
  loki:

services:
  loki:
    image: grafana/loki:latest
    restart: always
    ports:
      - "127.0.0.1:3100:3100"
      - "127.0.0.1:7946:7946"
    command: -config.file=/etc/loki/loki-local-config.yaml
    networks:
      - loki
    volumes:
     - ./loki/loki-local-config.yaml:/etc/loki/loki-local-config.yaml
     - ./loki/wal:/tmp/wal
     - ./loki/rules:/tmp/rules
     - ./loki/index:/tmp/index
     - ./loki/chunks:/tmp/chunks

  grafana:
    image: grafana/grafana:latest
    ports:
      - 127.0.0.1:3000:3000
    restart: always
    env_file:
      - .env
    volumes:
      - grafana-data:/var/lib/grafana
    networks:
      - loki

  alertmanager:
    image: prom/alertmanager
    container_name: alertmanager
    command:
      - '--config.file=/etc/alertmanager/config.yml'
      - '--storage.path=/alertmanager'
    volumes:
      - ./prom/alertmanager.yml:/etc/alertmanager/config.yml
    ports:
      - 127.0.0.1:9093:9093
    networks:
      - loki


   volumes:
     grafana-data:
In the Loki configuration file, enter the following:
auth_enabled: false

server:
  http_listen_port: 3100

ingester:
  lifecycler:
    address: 127.0.0.1
    ring:
      kvstore:
        store: inmemory
      replication_factor: 1
    final_sleep: 0s
  chunk_idle_period: 5m
  chunk_retain_period: 30s
  max_transfer_retries: 0
  wal:
    dir: /tmp/wal

schema_config:
  configs:
    - from: 2018-04-15
      store: boltdb
      object_store: filesystem
      schema: v11
      index:
        prefix: index_
        period: 168h

storage_config:
  boltdb:
    directory: /tmp/index

  filesystem:
    directory: /tmp/chunks

ruler:
  storage:
    type: local
    local:
      directory: /tmp/rules
  rule_path: /tmp/rules/fake
  alertmanager_url: http://alertmanager:9093
  ring:
    kvstore:
      store: inmemory
  enable_api: true

limits_config:
  enforce_metric_name: false
  reject_old_samples: false
  reject_old_samples_max_age: 168h
  max_cache_freshness_per_query: 10m
  split_queries_by_interval: 48h
  per_stream_rate_limit: 512M
  cardinality_limit: 200000
  ingestion_rate_mb: 1024
  ingestion_burst_size_mb: 1024
  max_entries_limit_per_query: 1000000
  max_label_value_length: 20480
  max_label_name_length: 10240
  max_label_names_per_series: 300
The loki folder is temporary storage for Loki. You can read the exact explanation on the Loki website.
Fill the alertmanager.qqyml file in the prom folder you created earlier with the following:
route:
  group_by: ['alertname']
  group_wait: 30s
  group_interval: 5m
  repeat_interval: 1h
  receiver: 'email'
receivers:
- name: 'email'
  email_configs:
  - to: '**Recipient of the notification e-mail**'
    from: '**Sender of the notification e-mail**'
    smarthost: '**e-mail host**:587'
    auth_username: '**auth mail/username**'
    auth_identity: '**auth mail**'
    auth_password: '**e-mail password**'

inhibit_rules:
  - source_match:
      severity: 'critical'
    target_match:
      severity: 'warning'
    equal: ['alertname', 'dev', 'instance']
Start the containers with the command:
docker-compose up -dInstall Promtail for log aggregation
The Nextcloud logs have to get to Loki somehow. We do this via the free software Promtail.
While it would have been possible to install Promtail over Docker, trust me: you don't necessarily want to mess with docker networking if you can work around it.
Also, you can use Promtail + Loki in the longer term for other logs than just Nextcloud. Using Docker, you would have to additionally mount every single log you want to monitor. That's one more line per log.
Promtail is in the same git as Loki. You can find the latest version here.
At the time of this article, version 2.7.1 is current:
# apt system
wget https://github.com/grafana/loki/releases/download/v2.7.1/promtail_2.7.1_amd64.deb && dpkg -i promtail_2.7.1_amd64.deb
# rpm system
wget https://github.com/grafana/loki/releases/download/v2.7.1/promtail-2.7.1.aarch64.rpm && rpm -i promtail-2.7.1.aarch64.rpm
The installation creates the /etc/promtail-local-config.yaml file.
Change the configuration as follows. Remember to adjust the path for the Nextcloud audit logs that you specified in the Nextcloud configuration:
server:
  http_listen_port: 0
  grpc_listen_port: 0

positions:
  filename: /tmp/positions.yaml

clients:
  - url: http://localhost:3100/loki/api/v1/push

scrape_configs:
- job_name: system
  static_configs:
  - targets:
      - localhost
    labels:
      job: varlogs
      __path__: /var/log/*log
- job_name: nextcloud
  static_configs:
  - targets:
      - localhost
    labels:
      job: nextcloud
      __path__: **ADD your Nextcloud audit path HERE**
Start promtail:
systemctl enable --now promtail.serviceSet Loki data source in Grafana
You can reach your Grafana instance via port 3000.
Default login for grafana is admin:admin
After login you have to add Loki as data source.
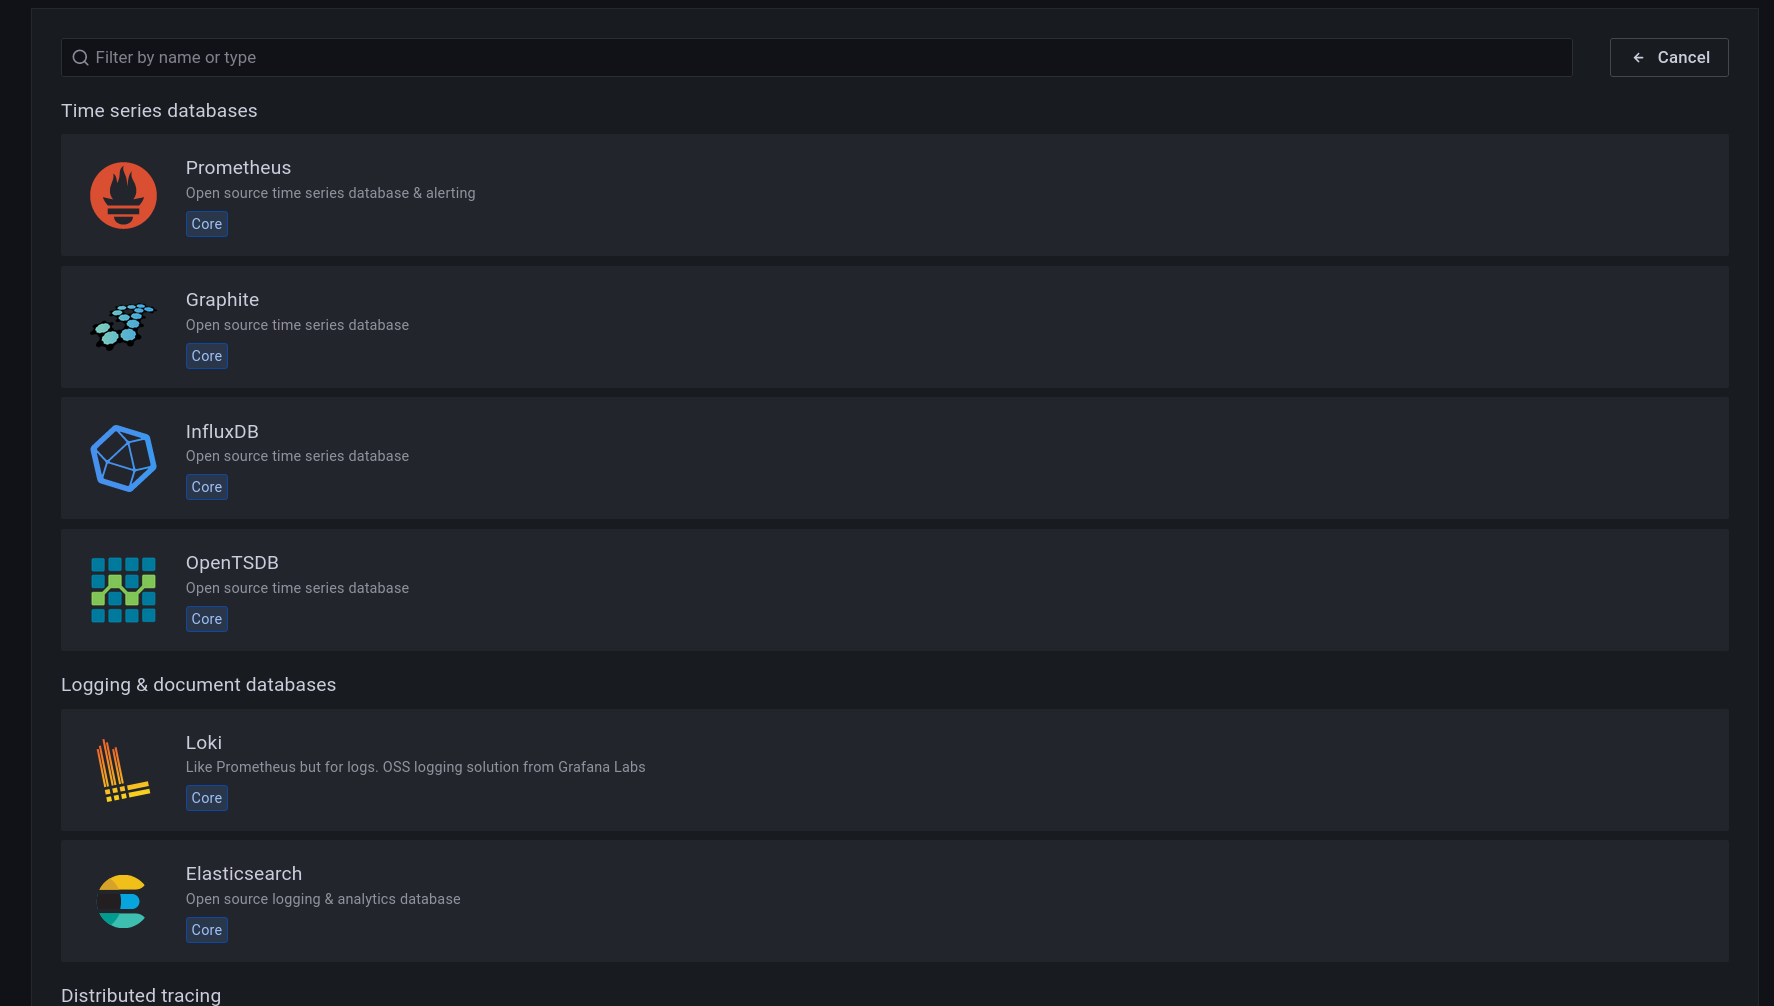
Since Loki belongs to the same Docker compose stack, you can simply address Loki via loki. Fill in the configuration as follows and also set custom http headers for websockets.
Connection: Upgrade
Upgrade: websocket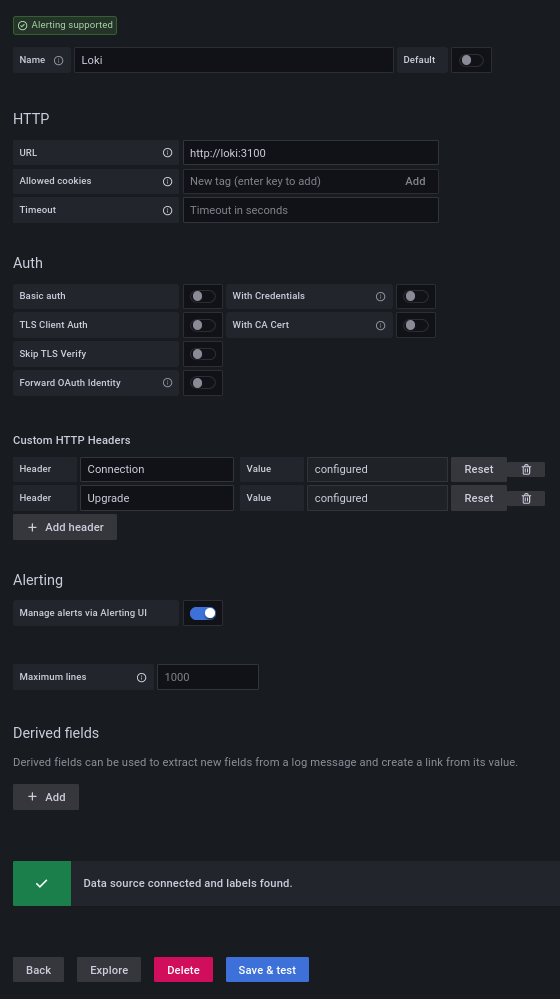
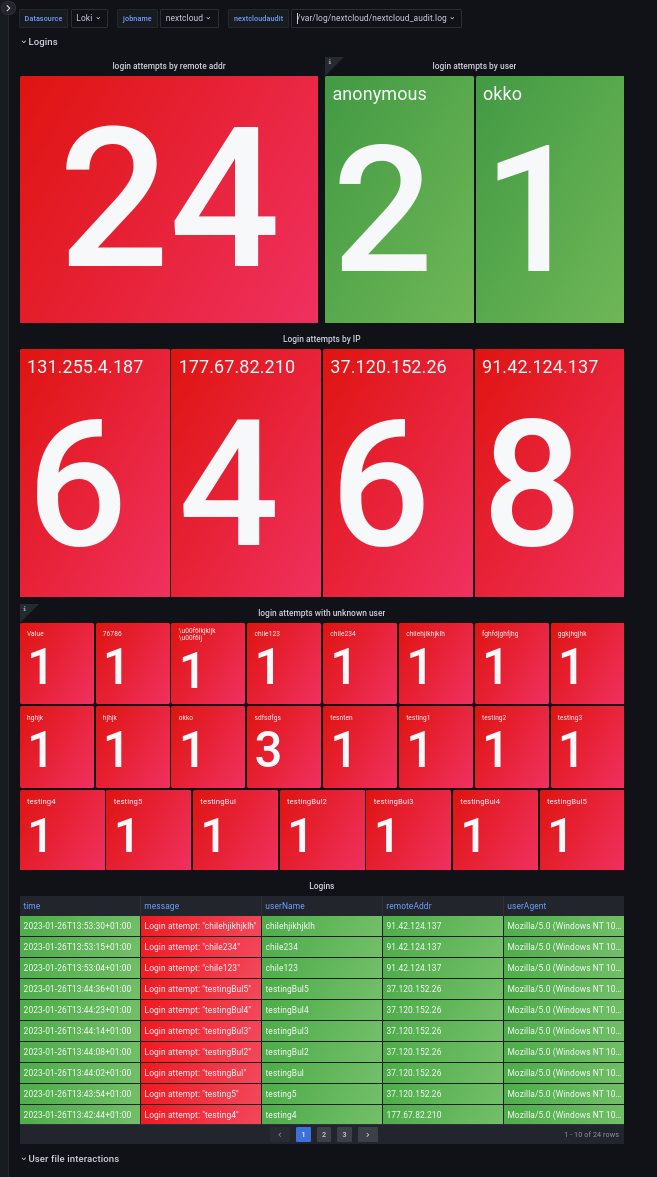
Create a dashboard for Nextcloud
This is the fun part because it's quick.
Import a new dashboard:
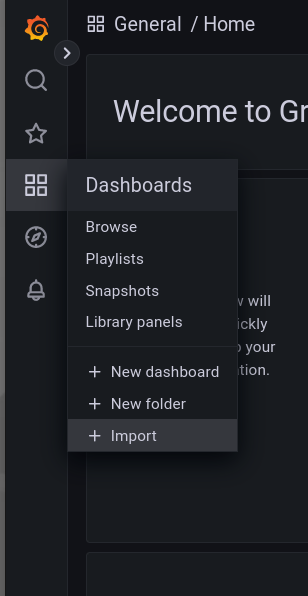
There is already a predefined dashboard under the ID 17987
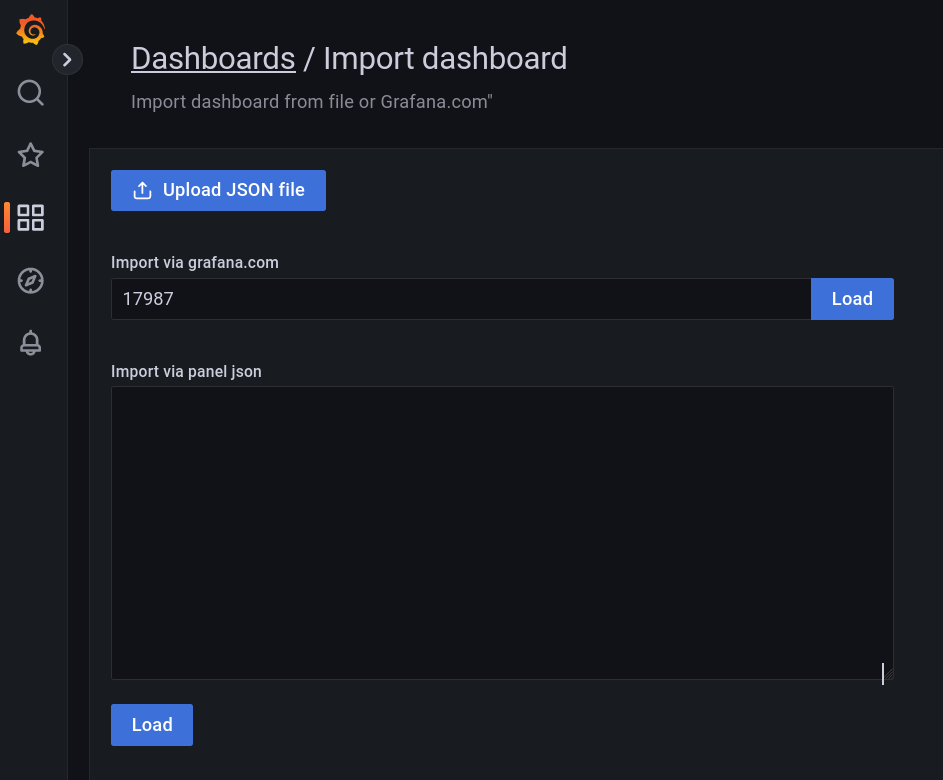
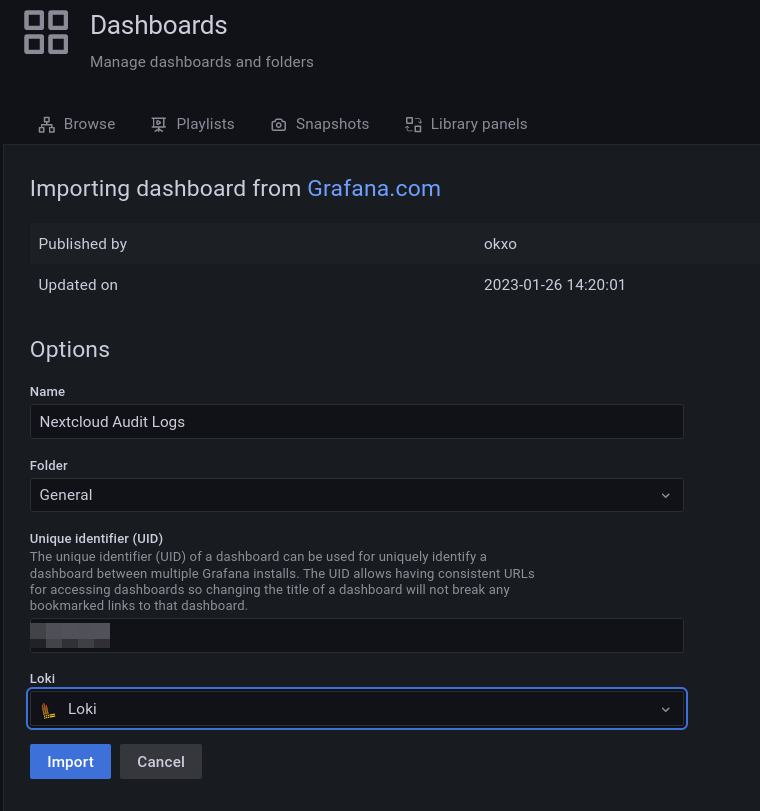
Click on Load and set loki as the data source.
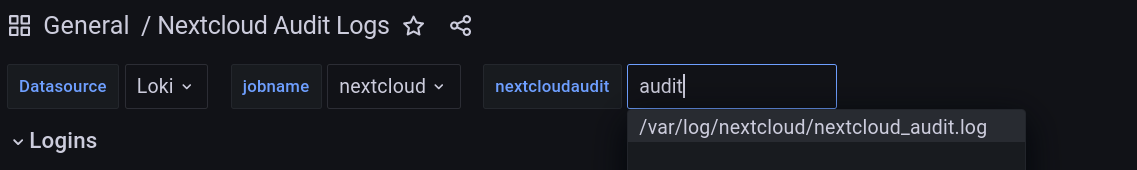
In the last step, only the variables from the dashboard need to be adjusted.
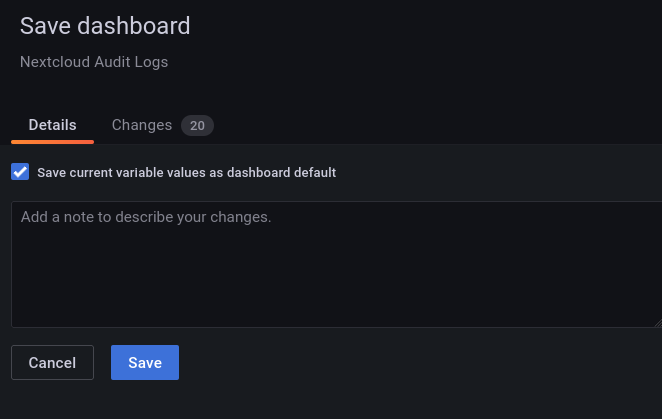
Click on the save icon in the upper right corner and make sure that the "Save current variable values as dashboard default" is checked.
The dashboard is ready. Take a look around and familiarize yourself with the dashboard.
Create alert rules for notification
Since we are not in front of the screen at all times, rules for alerting must be created.
To do this, we use the Prometheus alert manager previously installed via Docker.
The rules are created via YAML code in the loki/rules folder.
To do this, we must first create a new tenant folder for the rules. For some reason, Loki has adopted the name "fake".
cd loki/rule
mkdir fake
cd fake
touch nextcloud.yaml
Rules for notification are created in the nextcloud.yaml file.
Rules consist of:
- Name
- Rule
- Expression in LogQL syntax
- Label for severity
- annotation.
You can check out some sample rules on my git to get started.
The rules are enough to make a few things for yourself. Of course, you can also simply adopt them.
Save the file and make sure that every space is in its correct place (YAML syntax!).
Restart the container stack:
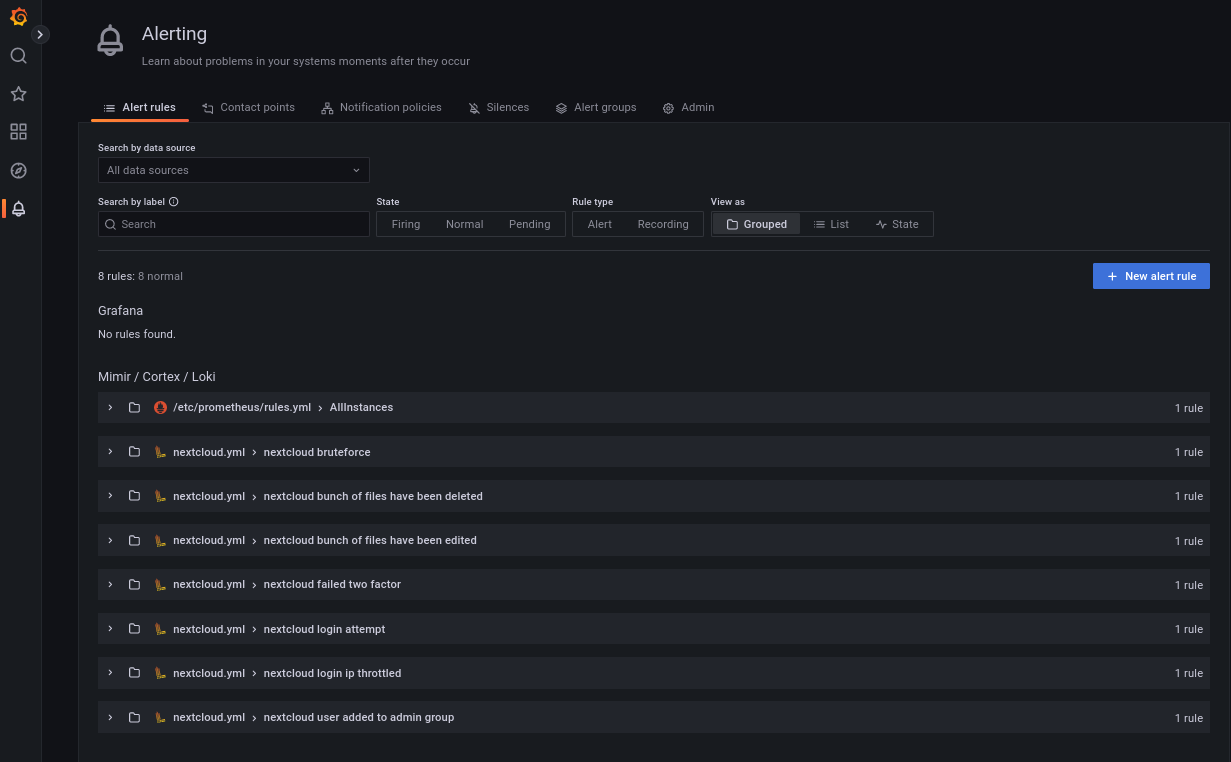
docker-compose down && docker-compse up -dContinue on the Grafana interface and look at the item "Alert rules".
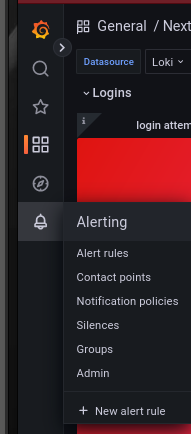
Grafana fetches the alert rules via API. You should see some new rules.
A few more things
I strongly advise to run Grafana, Loki and Promtail only behind a reverse proxy for security reasons.
The source code to the dashboard is freely available on Github.
The dashboard took a bit of a cue from Voidquark's dashboard, which however came to my attention relatively late.