Monitor Seafile libraries with Grafana
Unfortunately, Seafile does not know any real group folders or libraries.
Each library at Seafile must have an owner. If an admin releases a library, the users who have access cannot see how much quota is still free.
Unfortunately, this led several times in the past to the fact that in one of my environments libraries were full and the employees could not continue working.
However, with the help of Seafile API, InfluxDB and Grafana, it can be fixed.
Create a Seafile API token
To have access to Seafile, you first need an API token.
Since we want access to all libraries, this must be the admin user.
Please make sure that https is enabled before you continue!
The easiest way to generate a token is via curl.he easiest way to generate a token is via curl.
Install curl if it is not already installed:
apt install curl -yand create a Seafile token:
# curl -d "[email protected]&password=123456" https://yourseafilecloudadress/api2/auth-token/
# {"token": "24fd3c026886e3121b2ca630805ed425c272cb96"}
Keep the token for now, but renew it from time to time.
Install and configure InfluxDB
Note: We use influxdb2 in the following.
# create rep influxdb.list
wget -qO- https://repos.influxdata.com/influxdb.key | gpg --dearmor | sudo tee /etc/apt/trusted.gpg.d/influxdb.gpg > /dev/null
export DISTRIB_ID=$(lsb_release -si)
export DISTRIB_CODENAME=$(lsb_release -sc)
echo "deb [signed-by=/etc/apt/trusted.gpg.d/influxdb.gpg] https://repos.influxdata.com/${DISTRIB_ID,,} ${DISTRIB_CODENAME} stable" | sudo tee /etc/apt/sources.list.d/influxdb.list > /dev/null

apt update
apt install influxdb2
InfluxDB starts automatically. You can configure the database via http://YourlocalIP:8086.

In the example, we use "SeafileMonitor" as the organization name. You can choose your own entry, but then you have to change the organization name in the code of the parser.
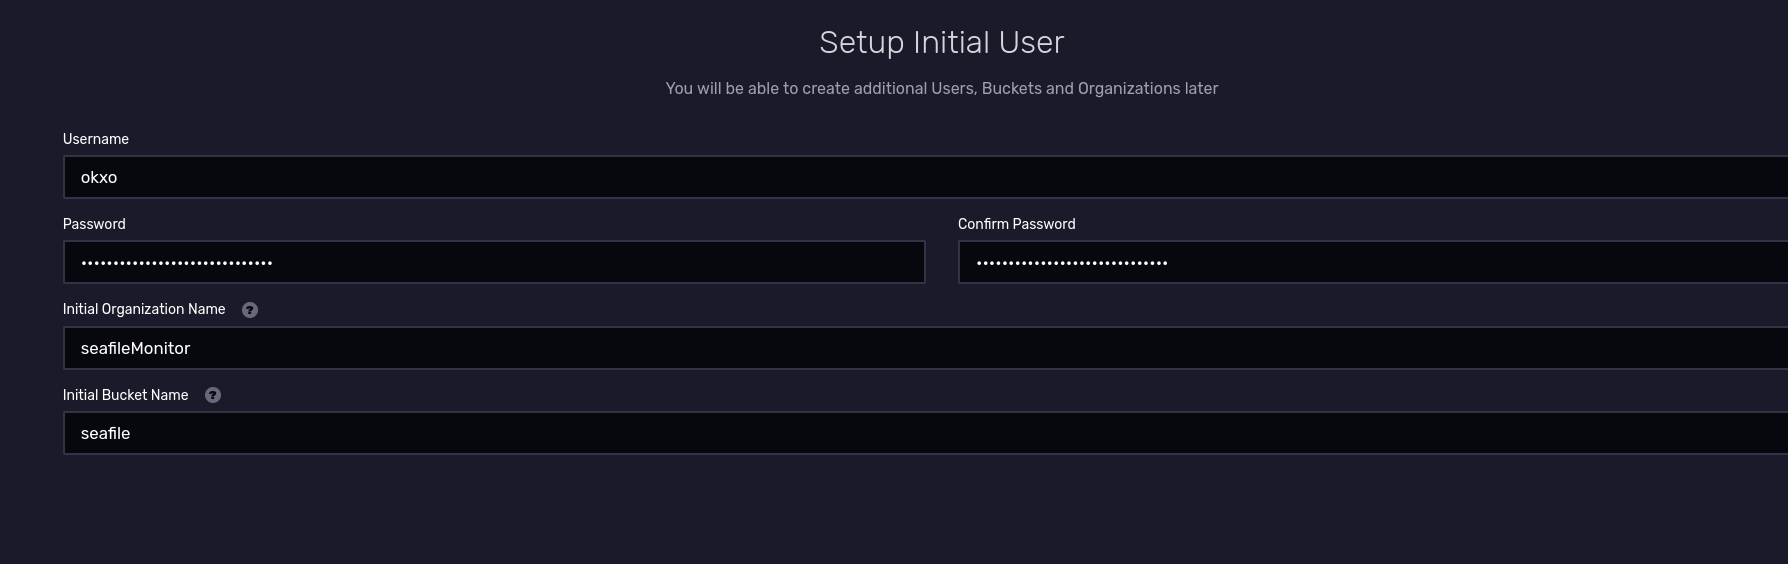
BucketName doesn't matter because we won't be using the default one.
Go to "Load Data" and click on API tokens.
Create a new bucket under the name "seafileData". Here you can also choose your own name, but then you have to make further adjustments.
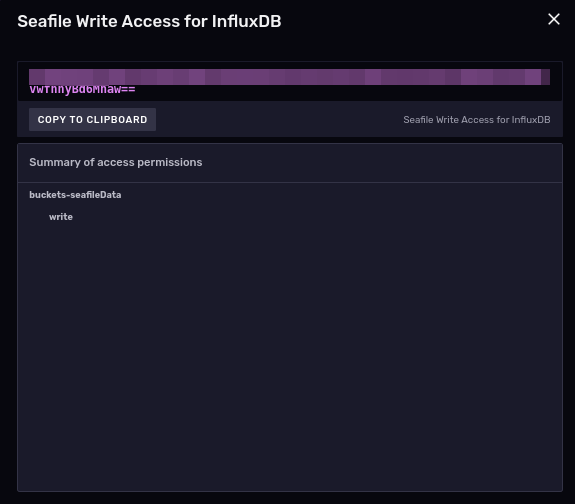
Create an API token with write permissions for the newly created database.
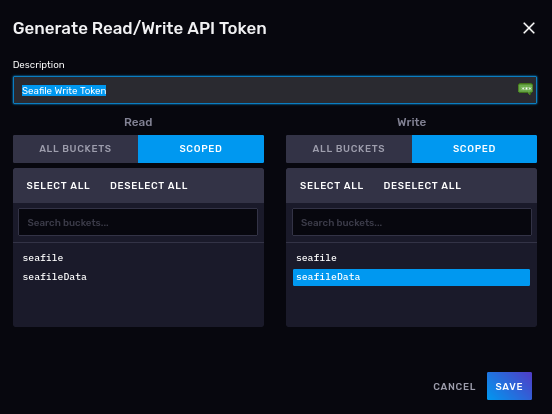
Create another one with read-only rights for the same bucket for Grafana.
You can see the token by double clicking on the name.
Install Plugin
Seafile cannot create time series out of the box.
We need a plugin that writes the data from Seafile to InfluxDB.
Download the plugin seafile-quota-to-influxdb from Github.
The plugin already contains all the required Python modules. The parser file is: plugin_seafile_quota_to_influxdb.py
-help show help file and options:
python3 plugin_seafile_quota_to_influxdb.py -help
Usage: plugin_seafile_quota_to_influxdb.py [options]
plugin_seafile_quota_to_influxdb.py fetches your seafile library quotas andwrites them to InfluxDB
Options:-h, --help            show this help message and exit
Generic options:-d, --debug         enable debugging outputs (default: no)
Host options:-u URL, --url=URL   Seafile server address-s TOKEN, --seafiletoken=TOKENSeafile server token
InfluxDB options:-H HOST, --host=HOSTInfluxDB Host (default: http://localhost)-p PORT, --port=PORTInfluxDB Host (default: 8086)-t PORT, --token=PORTInfluxDB Token (mandatory)Example input:
python3 plugin_seafile_quota_to_influxdb.py --seafiletoken 09xxxxxxxxda2dc2e5023 --url https://seafileserverAddress -t L1e4Vy4xxxxxxxxxxKFc35OyucTrTuDsWmueruGlKIt6gPF_n8DCAgFPqMtDch8Q== -dYou should use the debuging output (-d) only for testing or troubleshooting.
Create a systemd timer or a cronjob to run the plugin periodically.
Setup Grafana and alerting
Grafana is a powerful visualization tool for time series.
I assume that a Grafana instance already exists. If not: The installation of Grafana is very easy and well documented.
Go to "data sources" and select influxdb as source.
Fill in the fields in the screenshot below.
Enter localhost in URL if you installed Grafana on them same machine otherwise the remote IP.
Enter the readonly token, not the write-authorized one.
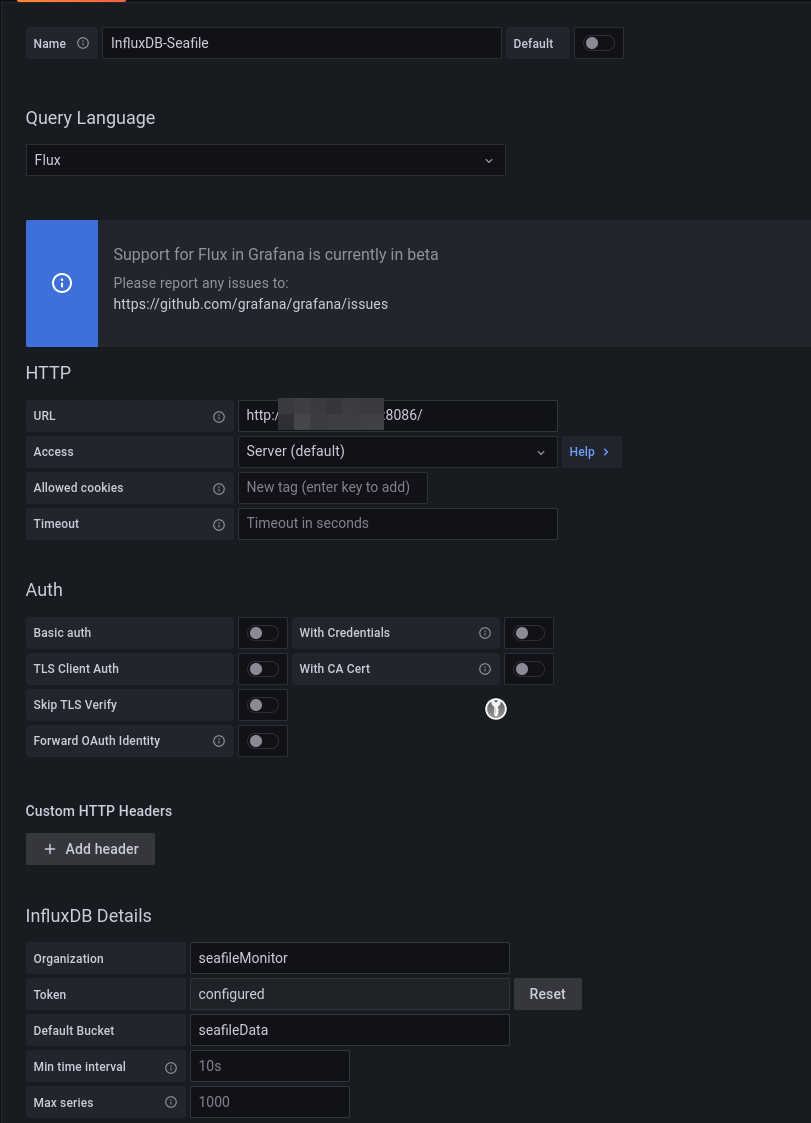
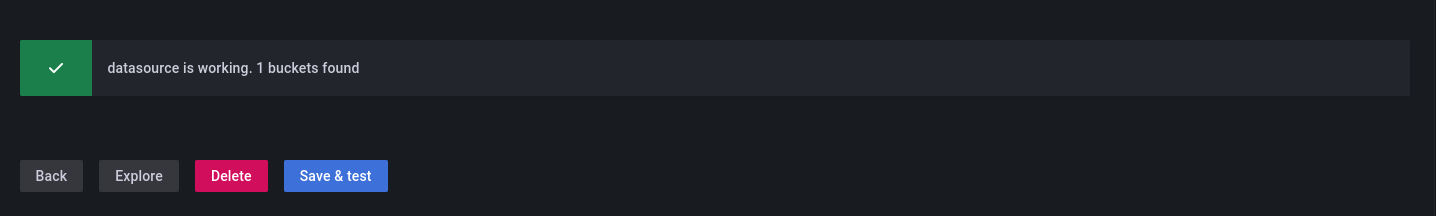
Test if the connection can be established.
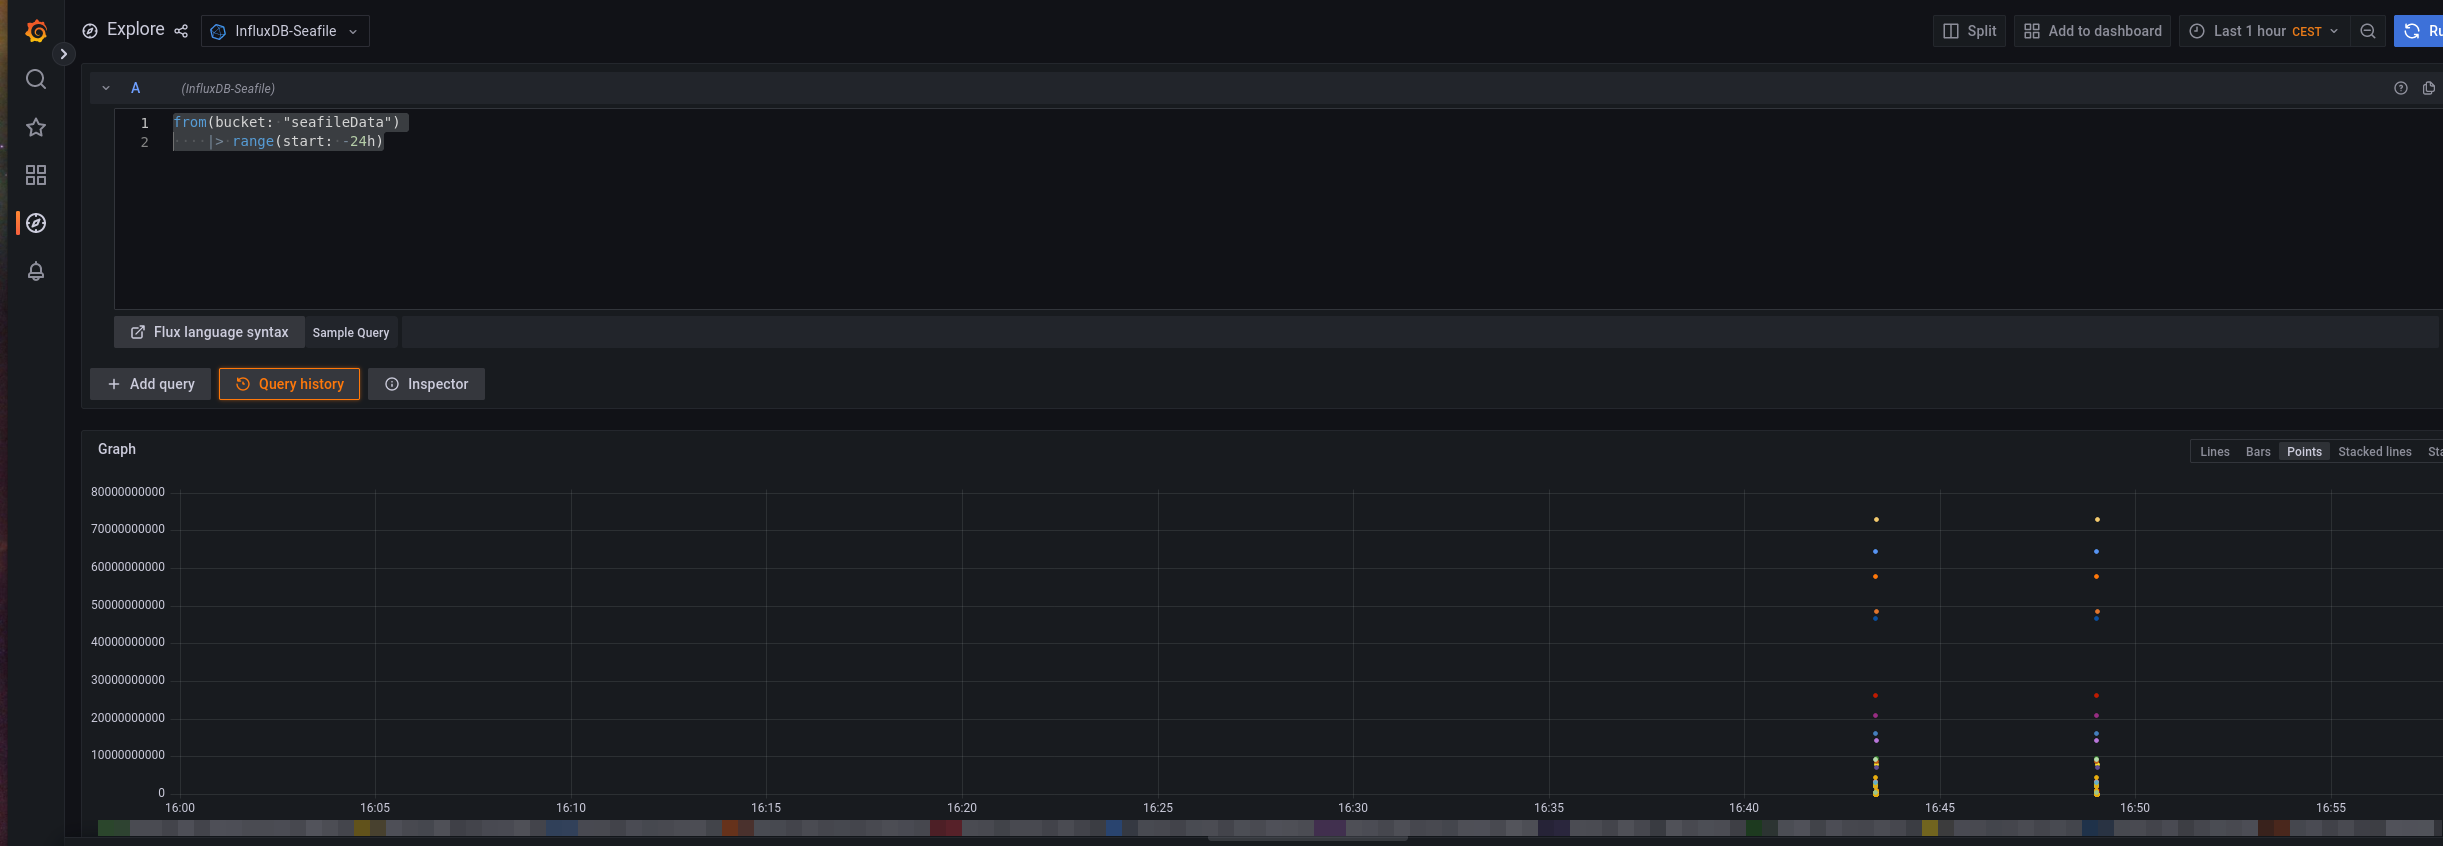
Now switch to the Query Explorer in Grafana and query for:
from(bucket: "seafileData")
    |> range(start: -24h)
If you've used the plugin a few times, there should be entries that are visualized.
We choose 24 hours because this always gives the best overview of quota changes. These usually do not increase creepily, but very quickly.
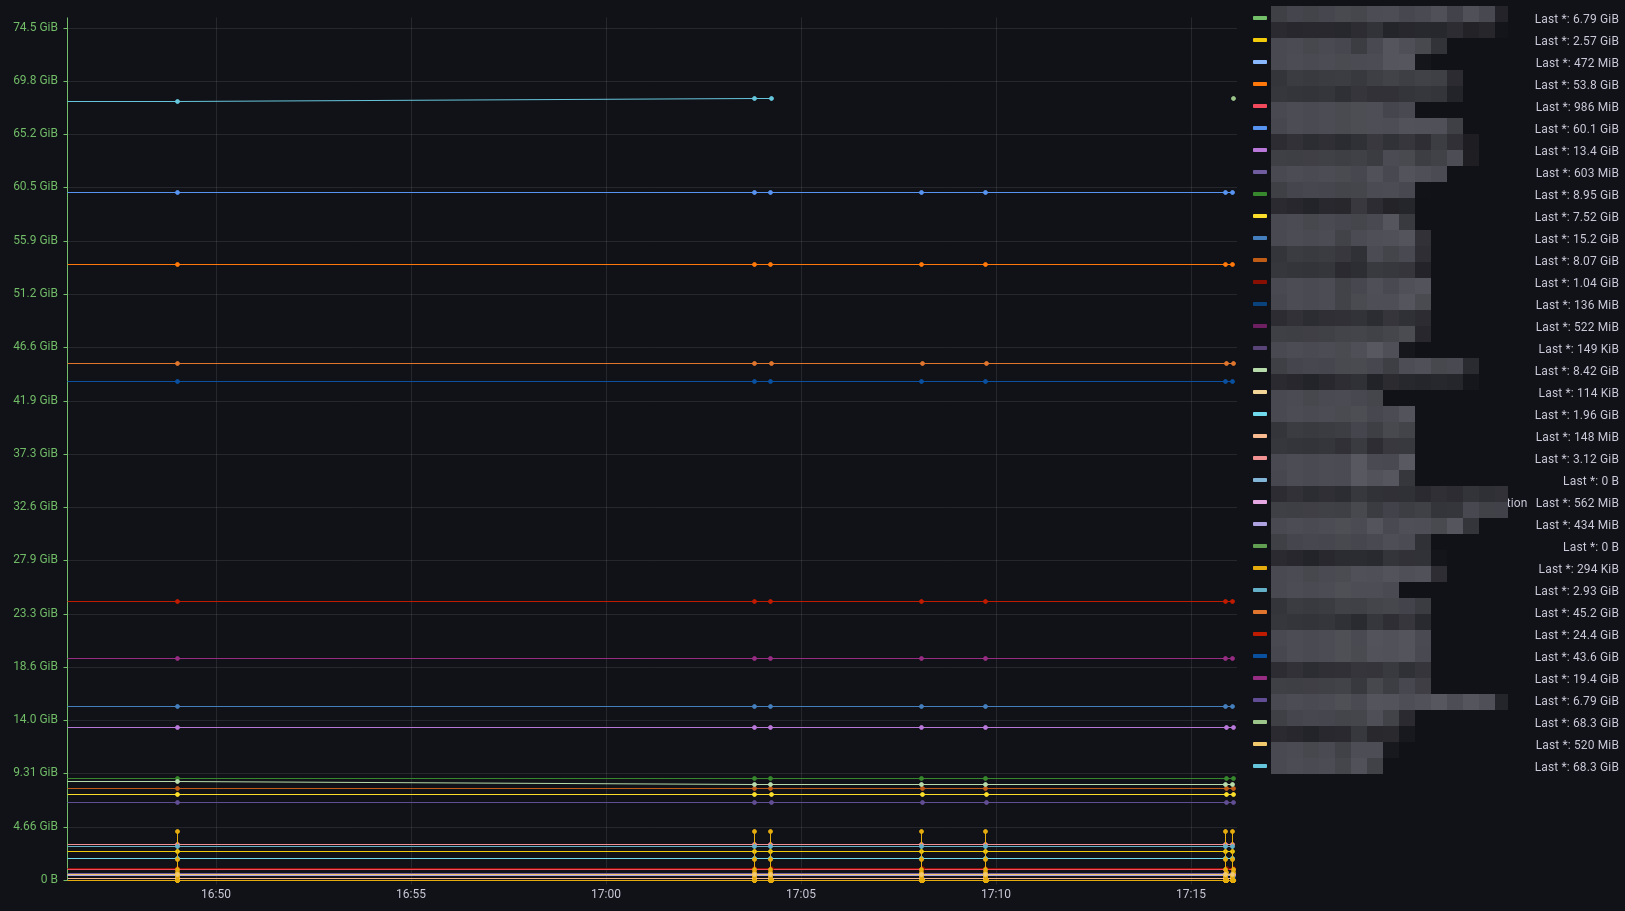
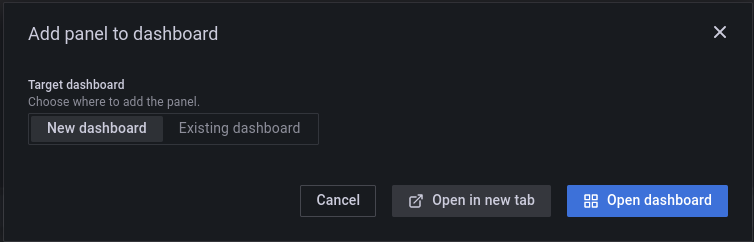
Use this query and add it to a (new) dashboard.
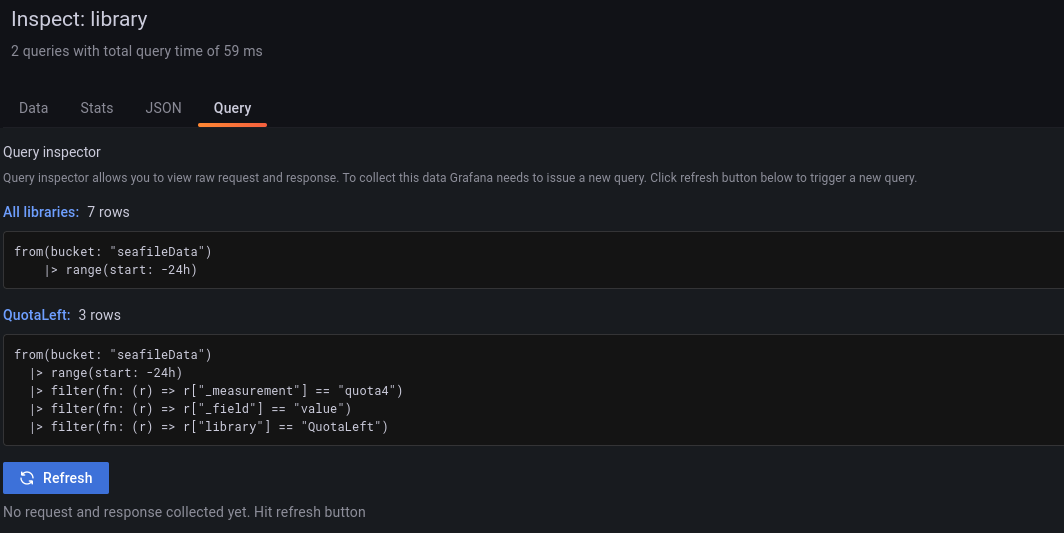
The parser now displays individual libraries with their current consumption. These are primarily interesting for finding out what caused the consumption.
Only one line is really relevant for us: QuotaLeft. If this value is 0, we no longer have a quota.
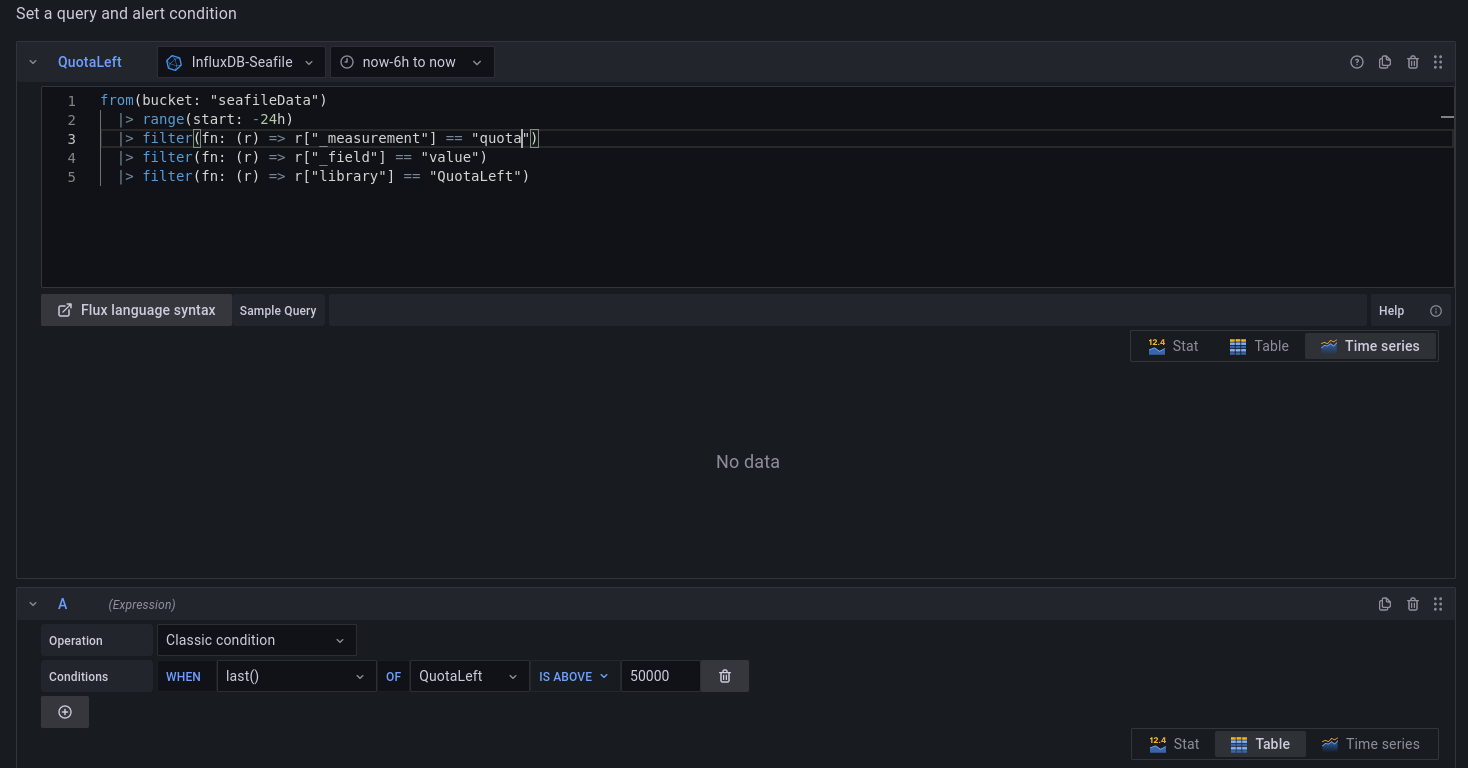
So we alarm with this value. Create a new query B in your dashboard:
from(bucket: "seafileData")
  |> range(start: v.timeRangeStart, stop: v.timeRangeStop)
  |> filter(fn: (r) => r["_measurement"] == "quota")
  |> filter(fn: (r) => r["_field"] == "value")
  |> filter(fn: (r) => r["library"] == "QuotaLeft")
So you should have two queries:
Your alert should look like this: